The urban designer Ken Greenberg has written about the “retreat of the industrial glacier” as a figure of speech describing the availability of land in cities that was formerly taken up by now-obsolete industrial or transportation uses. In Minneapolis and St. Paul, the central riverfronts of both cities fit this description: Minneapolis’ mills no longer produce more flour than anywhere else in the world, and St. Paul’s riverfront is no longer a hub of shipping. But what have those spaces become? This storymap, created by River Life staff, offers snapshot images of the Twin Cities through maps and aerial photographs from 1895, 1969, and 2018, and also provides other contextual information.
It is perhaps that “other contextual information” that holds some of the deepest insights on this map. The third pane of the storymap’s viewing area offers an image from Paul Durand’s work Where the Waters Gather and the Rivers Meet: An Atlas of the Eastern Sioux. In this 1982 book, Durand gathered Dakota place-names for sites across what is now the Upper Midwest, drawing on interviews with Dakota people and extensive research into the field notes and research of Joseph Nicollet, who was commissioned by the US government in the 1830s to survey the watersheds of the Mississippi and Missouri rivers. These Dakota place-names make clear that this area was deeply known by people well before the arrival of European and American settlers.
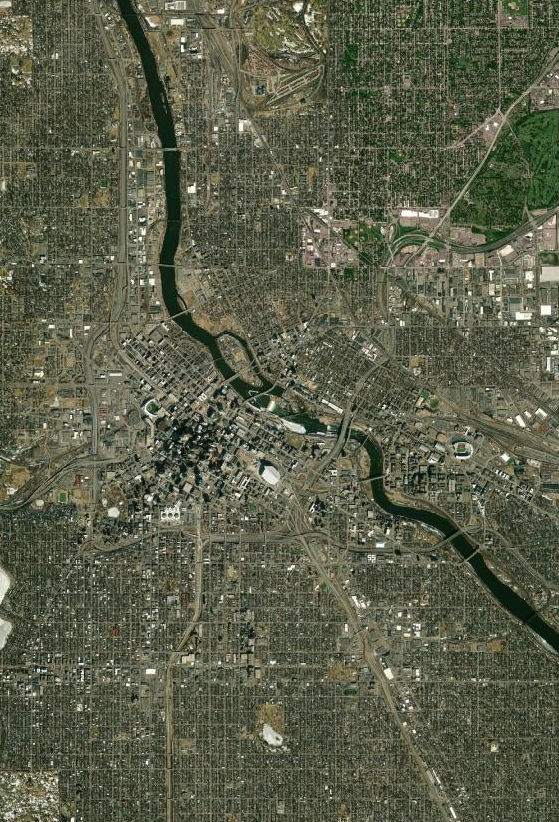
The aerial photographs and maps that cover the riverfront in Minneapolis (all three years) and St. Paul (1969 and 2018) offer the clearest way to describe change through time in a particular place. The storymap software includes a capability where two images can be shown side by side, and comparisons made directly by sliding a bar across the images, thereby shifting from one image to another and one time to another. Since the images scale in proportion to each other, it is possible to zoom in and examine a specific area quite closely.
For example, in 1969, the Minneapolis central riverfront was in a period of decline. The world’s leading producer of flour between 1880–1930, technological and transportation developments had shifted bulk flour production elsewhere. The Upper St. Anthony Lock had opened four years previously, in 1965, ironically, the same year that General Mills moved its corporate headquarters from Minneapolis to suburban Golden Valley. On the west bank, closest to downtown, the city fabric was completely taken up with parking lots, rail yards, and milling materials, between Washington Avenue and the river bank and the new I-35 W corridor to Hennepin Avenue.
Pane 7 on the storymap compares the U.S. Army Corps of Engineers map of the river in Minneapolis in 1895 with the 1969 aerial photograph. The west bank of the river, between the future I-35 W alignment and Hennepin, and extending inland to Washington Avenue, is of course completely given over to industry and transportation. This was the period that was the height of milling in Minneapolis, when more flour was produced here than anywhere else in the world. By the time of the 1969 image, many of the most prominent features from decades before are transformed, either removed (blocks of buildings replaced with parking lots through “urban renewal”), or rendered obsolete, as with the rail lines that no longer connect to a broader network. Many of the urban features shown here are the predecessor of 1969’s record that are either obsolete (railroad yards) or removed (blocks and blocks of surface parking after urban renewal stripped away the old buildings).
The real delight in the 1895 image is what it shows of the river itself. Spirit Island, a land feature of spiritual significance to Dakota people, remains; it would be completely removed for the construction of Upper St. Anthony Lock. Quarries are shown in the middle of Hennepin Island (where the St. Anthony Falls Laboratory is now) and on the west bank under what is now I-35 W. There is a notation of “boulders” below the Stone Arch Bridge and a string of numbers “8 6 8 8 1 3 1 0” just upriver. What could the numbers signify: depth? A measurement between two points that were known to Corps cartographers? More research is warranted!
The final pane of the storymap, a series of photographs of the Mississippi River in flood and drought, addresses questions about what impacts climate change will have on the region’s waters. This pane makes clear the fact that the “retreat of the industrial glacier” is not a “restoration” to some previous condition of land and water resources. Instead, a century and a half of urban industrial development compounded by a changing global climate are pushing the Mississippi River into previously-unseen conditions.
What does this storymap offer current scholars and planners? A great deal, I believe. Of course the connection to Paul Durand’s work is essential; we should always begin our work with indigenous perspectives. The comparative maps that illustrate over a century of change in particular places emphasize that the riverfront we have now is not always the riverfront we have had, and that our present conditions are not inevitable or the result of some “natural” process. Instead, they provide starting points for a clearer look at past choices, which can and should lead us to more clearly imagined futures.
Recent Posts
Making the Outdoors More Inclusive
America’s national and state parks have often been utilized by majority white populations. The assumption that the outdoors are a space for white, able-bodied people who have resources and time continues to influence who uses green space...